
This section of the user manual is going to focus on the two simple settings after you’ve generated a report. If you want to more details and information on how to customize existing reports as well as create your own custom reports then we’ll refer you to the Templating section. If you are looking for details on how to customize the letterhead/logo then you get more details by clicking here.
Hide/Show Chart
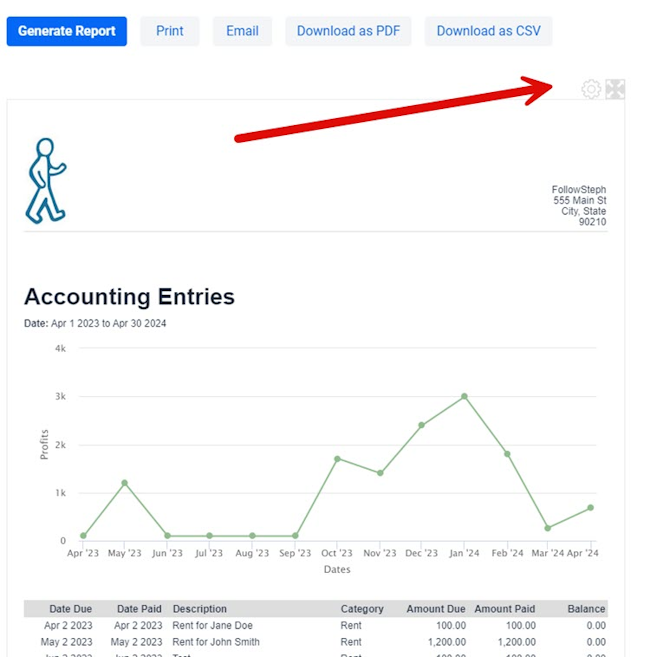
Although you can customize the report templates to automatically always show/hide the charts in the reports in some cases you will want to do this on a case by case basis depending on why the report is generated, who it could be sent to, and so on. In these cases you click on the gear cog icon on the top right of the report to show/hide the chart in the generated report.
Expand Report to Screen Width
All reports are designed to be displayed on the screen to match the width of a standard sheet of paper but you can override this to have the report use the full width of the available screen by clicking on the expand/collapse box on the top right, also shown on the above screenshot. Some reports can have a lot of data which can be easier to read if more spread out, or you may have created custom reports that will never be printed and are only meant to be displayed on the screen so why not take full advantage of all the screen real estate available rather than be limited to the width of a sheet of printing paper.